Lesson Title
Instructor and Student names
The instructor will edit the header above to reflect the lesson content and add their and the student’s names as authors. The instructor should also update the text below to give a link to the assigned reading:
Assigned Reading:
Coyle, JR. 2017. Intraspecific variation in functional traits reveals limited effects of microclimate on community assemble in temperatedeciduous oak canopies. Oikos 126: 111-120. DOI: 10.1111/oik.03239
Key Points
The instructor will fill in a description of the topic here followed by a bulleted list describing key features of the statistical analysis method. For example:
- When to use this analysis
- When not to use this analysis
Analysis Example
The student discussion leader will place their example code in this section, including text that describe the purpose of each code block.
First you will probably need to read in data. If you have uploaded the data file on the course GitHub repository in the data folder then you should be able to read in the data as follows by changing the name of the file after data/:
# Read in a data file from the data folder on the BIO 202 GitHub repository
dat <- read.csv(file.path(repo_url, "data/macrolichen_traits_Coyle_2016.csv"))

# Or, read in the data file from a folder on your computer
# Remove # from the following 3 lines and change the file path assigned to my_dir
# my_dir <- "/Path/to/your/working_directory"
# setwd(my_dir)
# dat <- read.csv("lichen_traits_Coyle_2016.csv")
Make a code block that loads any packages needed for the analysis. It can be helpful to indicate which functions come from which packages. Note that you may need to install packages using install.packages('package_name').
# Load dplyr: filter
library(dplyr)

# Load ggplot2: ggplot
library(ggplot2)
Next describe how you will manipulate the data in order to perform the anaylsis.
Include any relevant code below, making sure to include a # comment for each line.
# Subset the data to foliose lichens
fol_dat <- dat %>%
  filter(Growth_form == 'foliose')
Describe the steps of the example analysis, including code blocks as needed. Describe the functions and packages used.
## Warning: Removed 213 rows containing missing values (geom_point).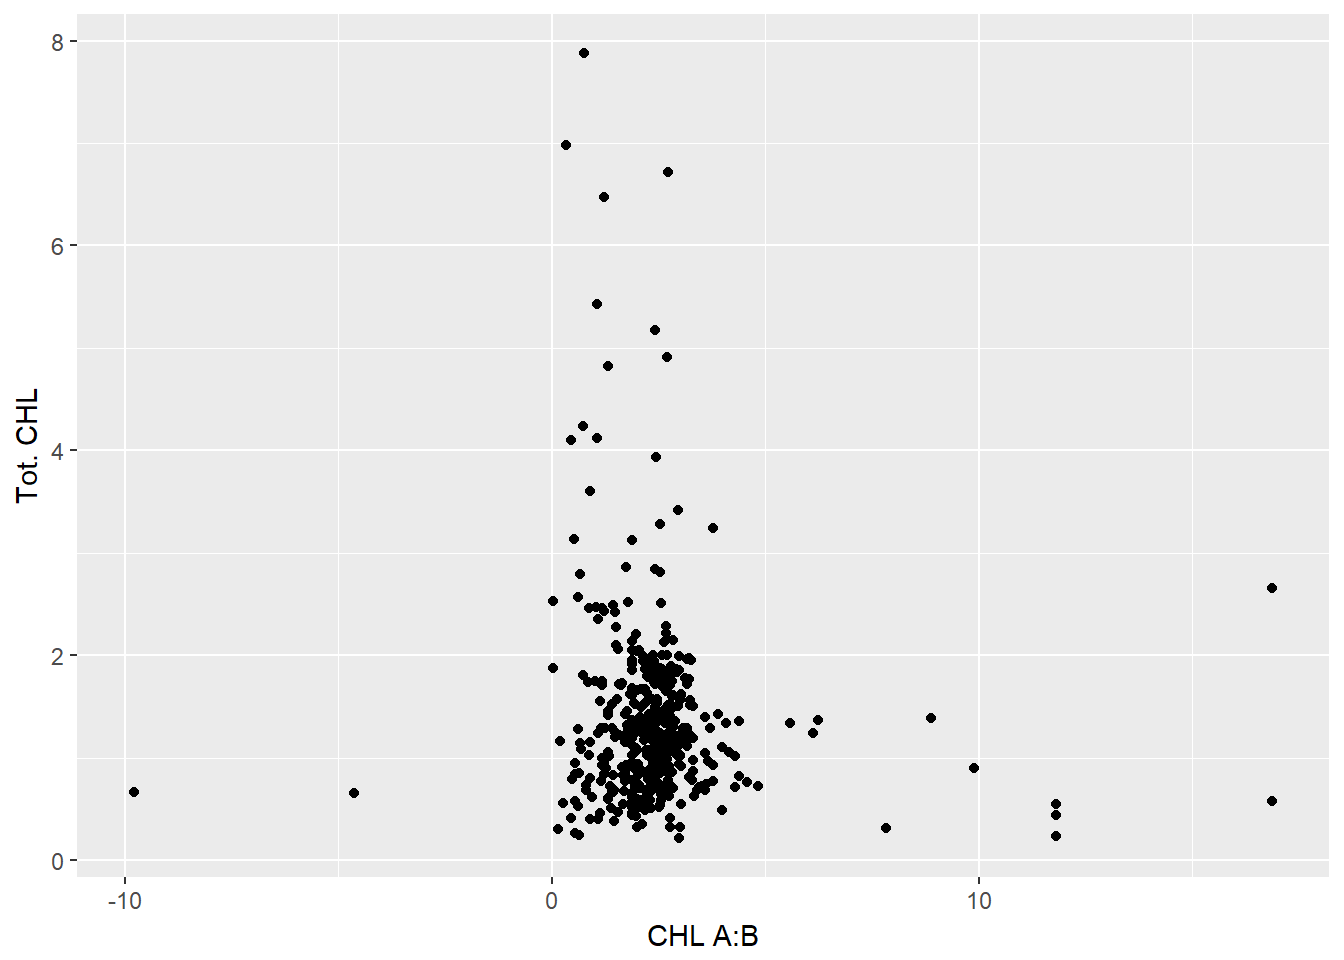
Figure 1. Total chlorophyll versus ratio of chlorophyll A to B. Looks like we have some data cleaning to do!
Discussion Questions
Include any questions or issues here that you want to discuss or ask about in class. After the class session, update this section with any important notes discussed.
- Question 1:
- Question 2:
- Question 3: